Changing the Axis ("Frame") Layout
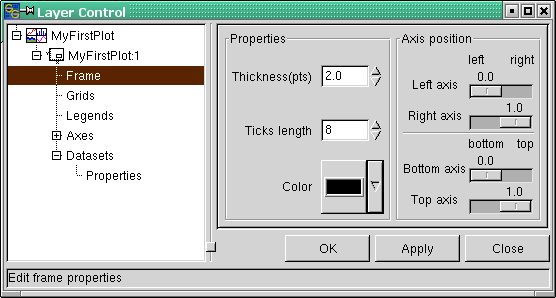
Now that position, size and background color of the graph are defined, we choose the next entry in the dialog tree which is named "Frame" (see Figure 3-7). With this dialog, one can change the thickness and color of the frame of axes that surrounds our graph "MyFirstPlot".
As an example, we change the color of the axis frame to dark blue ("Color" dropdown list box). Because these are self-explaining features, just play around with them. Remember that changes are invoked only if you press the "Apply" button. Because these settings are of no further concern for our tour through SciGraphica, please set them back to: thickness = 2.0, ticks length = 8, color = black, before proceeding.
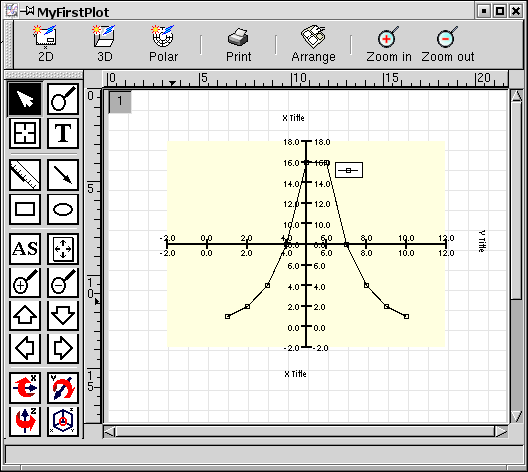
SciGraphica also enables us to change the axis position. What does that mean? To find that out, just set the four sliders to a value of 0.5 and then press the Apply button. Your graph should now look like in Figure 3-8.
While this kind of presentation has its advantages in certain cases, it is not so helpful for the next steps. So please change these settings to those in Figure 3-7.

