General Layer Properties
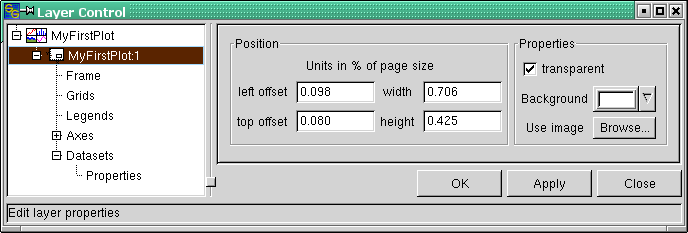
After having adjusted the graph page properties, the next step is the formatting of the graph itself. Click on the "MyFirstPlot:1" entry in the tree. The dialog changes to show the items in Figure 3-3. It allows you to change the position and size of the graph by precise numbers instead of dragging by mouse.
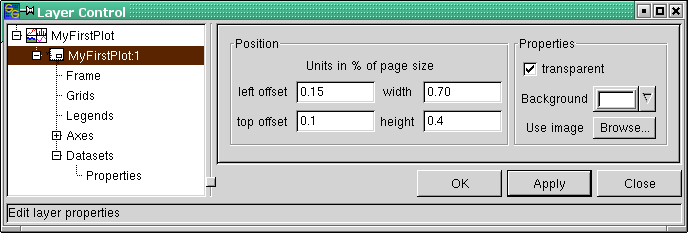
Let us input some new numbers. The numbers that have to be entered represent a fraction of the page size (not percentage, as labeled in the dialog; e.g. width = 1.0 will be 100 percent of the page size). Just take the numbers as shown in Figure 3-4 and press the "Apply" button. Position and size of "MyFirstPlot" should have changed according to the new settings.
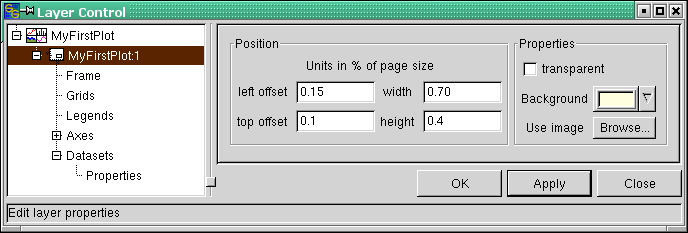
As a last thing, we will change the background color of the graph. To do so, first uncheck the "transparent" checkbox. Then click the dropdown arrow of the "Background" list box. Choose some color (See Figure 3-5) from the palette which appears and then press the "Apply" button.
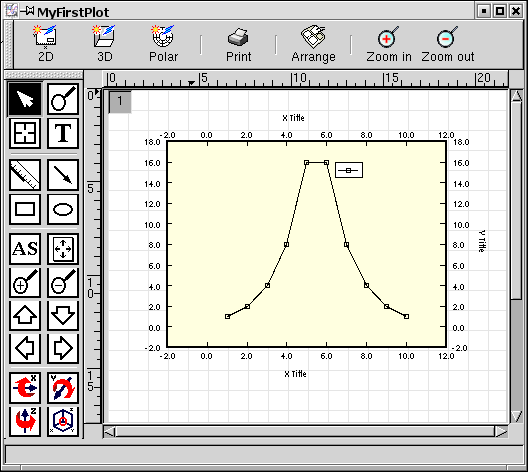
The graph should now look like in Figure 3-6.


