Adding Grids
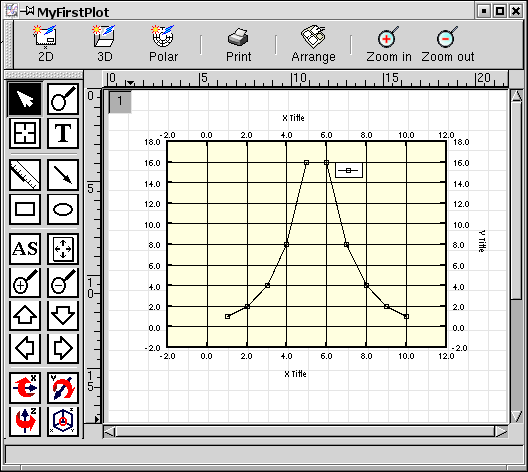
With the help of the "Grids" dialog we can switch on grids. As you may see, we now have a tabbed dialog - one for the x axis and one for the y axis. To see the effect of grids, we choose the settings according to Figure 3-9. After having pressed the "Apply" button, we do the same settings for the y axis (just click the y axis tab and repeat the procedure).
You will end up with a plot like in Figure 3-10.
Some of you may wonder where the minor grids (those showing a dotted line) are. Please be patient. They will appear as soon as we have applied some manual scaling to the graph.

