Chapter 3. Plotting the data
General Considerations
Before we start to plot the data now contained in the worksheet, let me explain their nature in short. The data are real life data taken from vibration measurements. The "AmplitTop" and "AmplitSide" columns represent frequency dependent vibration amplitudes from the top and the side of the measured structure, the "AccelTop" and the "AccelSide" columns the respective accelerations.
This tutorial's idea about how to visualize these data is to plot the data from the top and the side into two graphs on one page. The graphs are aligned such that they are identical in size, one graph above the other. The upper graph should contain the data taken from the top of the structure, the lower graph shows the data taken from one side. Each single graph is intended to contain the amplitude as well as the acceleration.
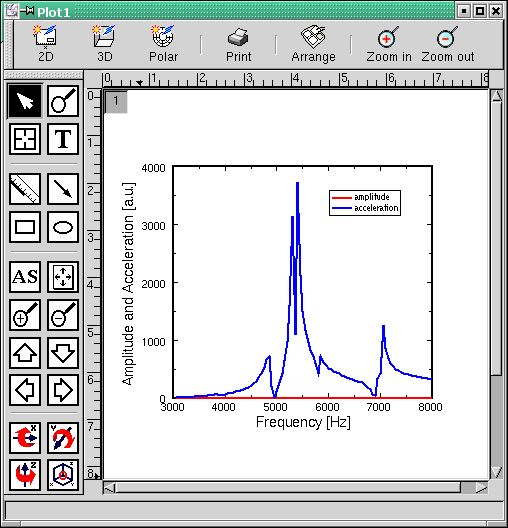
The latter is not as simple as it seems at a first glance. Maybe you take a look at the data. The accelerations reach values up to roughly 4000, whereas the maximum values for the amplitudes range from about 3 to 4. A simple graph containing both amplitude and acceleration would consequently look like in Figure 3-1. Due to the scaling which complies with the acceleration, the amplitude is only visible as a straight line.
Figure 3-1. If you plot amplitude and acceleration into one graph, the result is obviously not very enlightening...
As this is not the way to produce such a graph, we have to look for a different way to make it happen. Happily, SciGraphica provides everything needed to process such a task. The following sections provide a step by step guide how to set up such a graph.